For Data teams
Dashboards people can act on, not just read
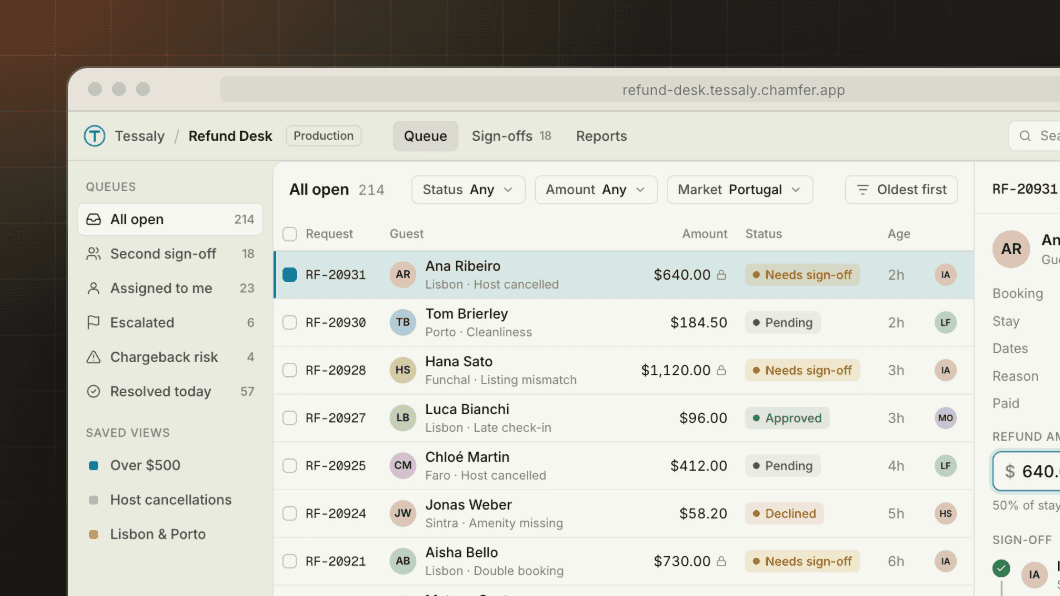
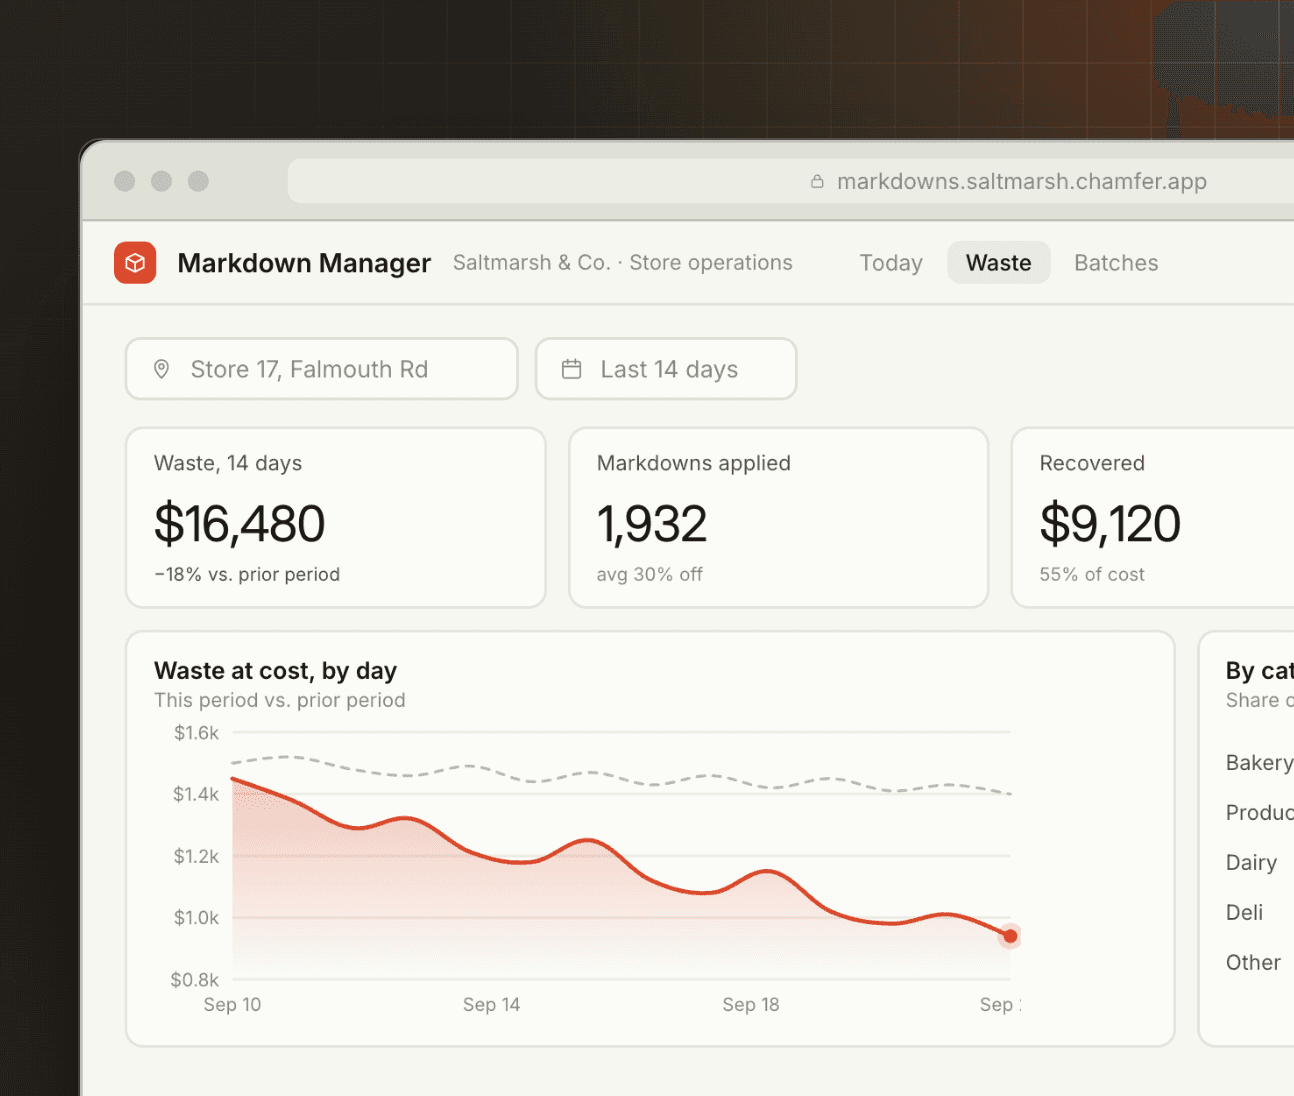
Build dashboards on Snowflake, BigQuery, Databricks or Postgres, and let people correct a number or approve the next step from the same screen. Each viewer sees only the rows their role allows.

One rule for who sees what
Write access by region, site or account once, and every chart and table applies it. A clinic manager sees one clinic. A regional director sees the region.
Queries that watch the bill
Set row limits, scan limits and caching per dashboard, so a busy Monday morning doesn't turn into a warehouse invoice nobody expected.
From chart to action
Next to each chart, people can fix a record, assign an owner or approve a batch, and every action lands in the Logbook.
01 — In production
How Fennimore Health gave 31 clinics one view of staffing
“Clinic managers build their own rota tools on Stockroom, and the row-level rules mean nobody sees a patient outside their site.”
Priya Raman
Director of Data, Fennimore Health
Read the story










02 — Example apps
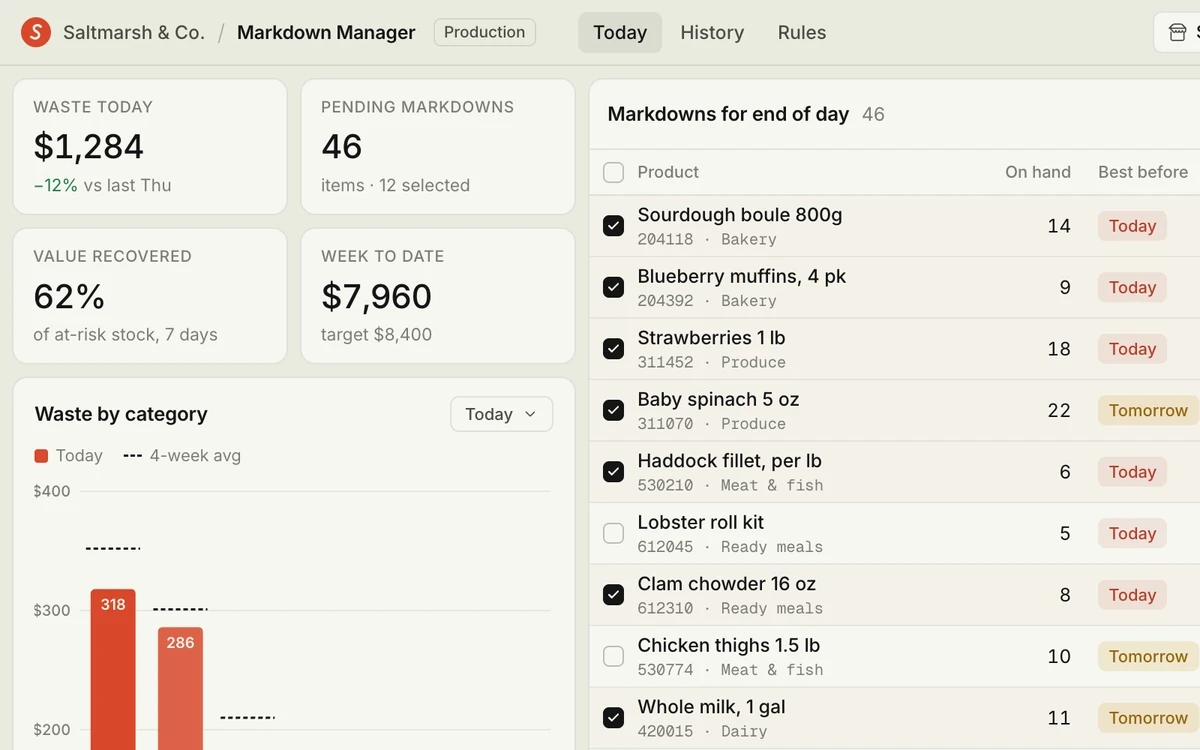
Dashboards teams built instead of another export
03 — What it includes
What makes a dashboard worth opening
Charts from a sentence
Ask for "waste by category for the last 30 days, by store" and get the query and the chart together. Both stay editable.
Filters people keep
Date ranges, regions and segments stay set for each viewer, and shared links carry the same filters.
One access rule everywhere
Every chart, table and export applies the same row-level rule, so a filter can't reveal data a role shouldn't see.
Write-back where it helps
Let people correct a forecast, add a note or flag a record, written to a table your data team controls.
Scheduled snapshots
Jobs send a PDF or a Slack summary every morning, built from the same governed queries.
Warehouse costs in view
Each query records its runtime and scan size in the Logbook, so you can see which dashboard costs what.


05 — FAQ
What teams ask about dashboards
How is this different from our BI tool?
Can viewers see only their own region or site?
Will dashboards slow down our warehouse?
Can we embed a dashboard in another tool?
Can people export the data?
Who maintains the queries?
06 — More use cases